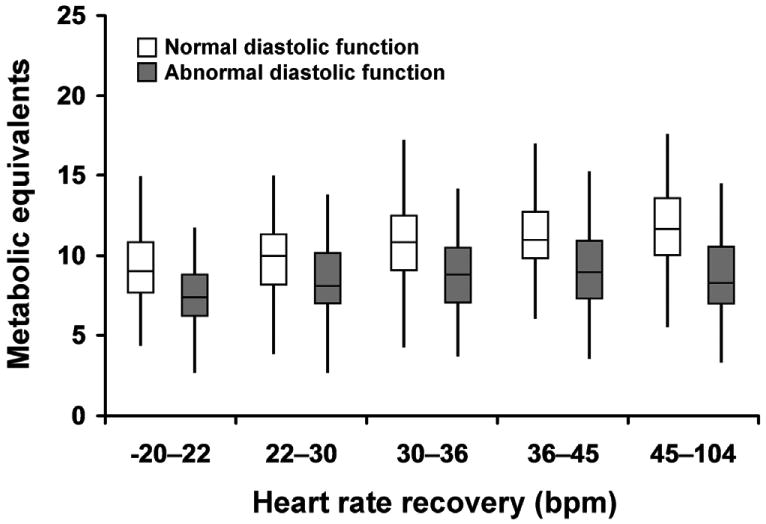
Figure 2.

The relationship between exercise capacity, as measured in metabolic equivalents, and diastolic function across quintiles of HR recovery. Patients with normal diastolic function (clear boxes) had greater exercise capacity within higher quartiles of HR recovery as compared to patients with abnormal diastolic function (shaded boxes) who had an attenuated exercise capacity despite increase in HR recovery. Boxes represent 25th-75th percentile and medians are denoted by the line within the boxes. The tails on either end of the boxes denote 10th-90th percentile. All pairwise comparisons between normal and abnormal diastolic function within each HR recovery quintile were significant at p<0.0001. Abbreviations: bpm = beats per minute.
