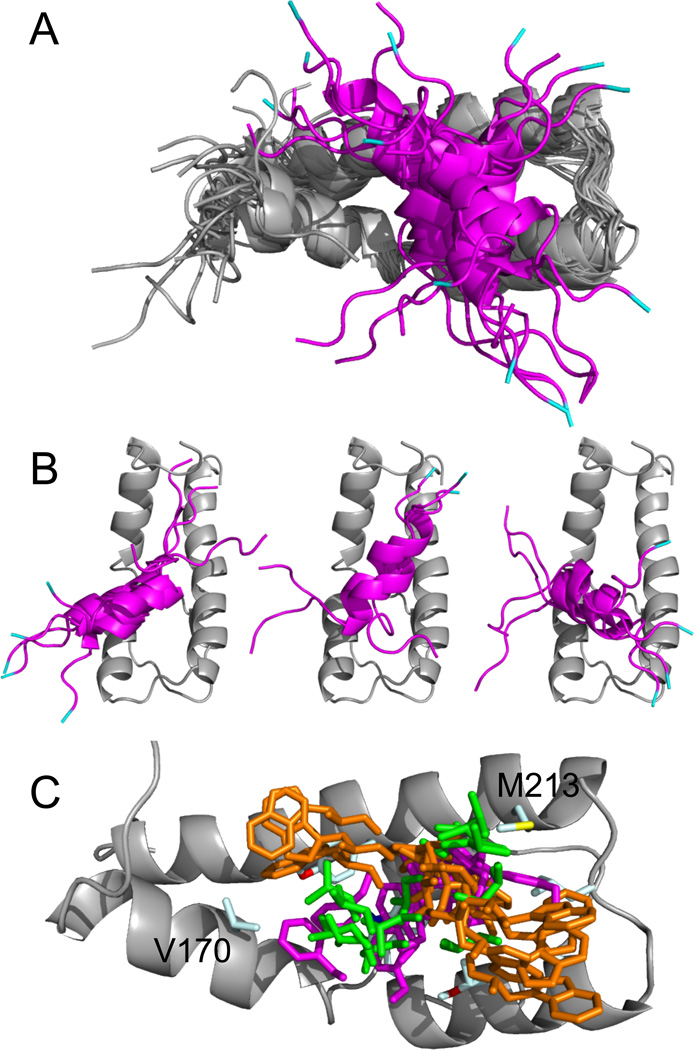
Fig 4. Models of the ABD1-cAD Complex Derived from NOE and Spin-Labeling Data.
(A) Ribbon representations for the ensemble of HADDOCK generated structures for Gcn4-cAD (magenta) binding to the ABD1 (gray). Gcn4 residues 101–112 and 131–134 have been removed for clarity and L113 (cyan) marks the N-terminus. (B) Three different orientations of the Gcn4 peptide are evident in the ensemble of structures depicted in (A). (C) Positions of key Gcn4 side chains W120 (orange), L123 (green), and F124 (magenta) relative to ABD1 (gray ribbon) are shown from the ensemble in (A). ABD1 residues V170 and M213 are labeled. The different modes of binding bring W120, L123, and F124 in proximity to both residues, consistent with observations derived from the (13C-edited, 13C-filtered)-NOESY (see Fig 3B).

