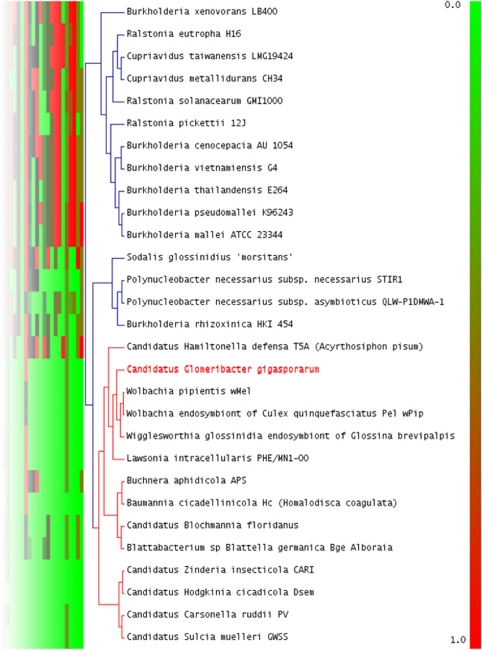
Figure 2.
Detail of the hierarchical clustering of KEGG metabolic pathways predicted for CaGg and other 28 genomes integrated in the MaGe database. CaGg metabolic profile clusters with 13 sequenced genomes of intracellular endosymbionts, irrespectively of their far phylogenetic position, and not with the related fungal endosymbiont, Burkholderia rhizoxinica. Red box: 100% pathway completion; Green box: 0.0% completion. For the complete figure see Supplementary Figure S3 and the corresponding legend in Supplementary Text S4.

