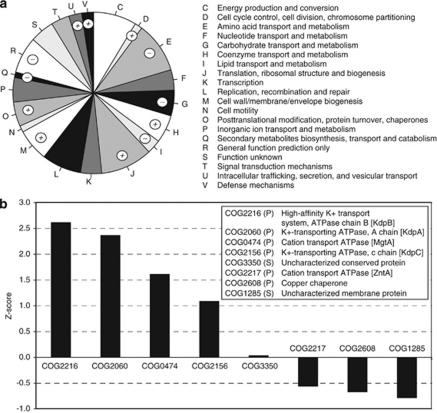
Figure 4.
(a) Proportion of reads assigned to COG categories. COG categories are listed to the right. Categories marked by a + or a − symbol are strongly over- or underrepresented in the snottite metagenome, respectively. (b) Standardized abundance scores of COGs classified as P-type ATPases according to the TransportDB (Ren et al., 2004). The COG id, category, description and gene name if available are provided in the legend.

