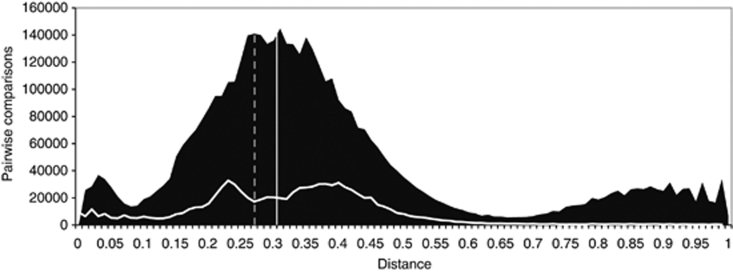
Figure 1.
Distribution of genetic distances for the MYI and seawater communities. The shaded region indicates the distribution of distances for the seawater community. The multi-modal distribution is a result of the dominance of a single genus (Pelagibacter) and the two-domain structure of the community. The white lateral line indicates the distribution of distances for the MYI community and the solid vertical line, the mean distance. The dashed vertical line shows the mean distance for the seawater community, excluding the domain Archaea.

