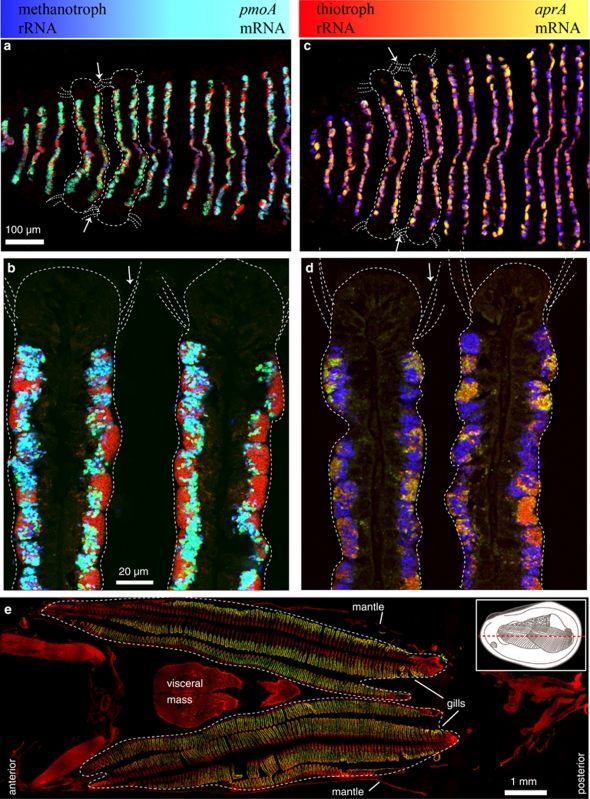
Figure 2.
Simultaneous FISH of rRNA and mRNA on cross-sections of juvenile B. puteoserpentis. Color panels at the top of the figure show the level of mRNA expression (colors on the left of the two panels indicate no mRNA expression and colors on the right show high expression levels). See Figure 2c for diagram showing where in the gills sections were taken. (a–d) Juvenile 6 with simultaneous FISH of mRNA (green) and rRNA of thiotrophic (red) and methanotrophic (blue) symbionts. Two gill filaments and the cilia at their frontal edges are outlined in each image (white dotted lines, arrows show the direction in which seawater and vent fluids enter the gills). (a) m/rRNA of methanotrophic symbionts. Methanotrophs with high pmoA expression levels appear turquoise, close to the ciliated epithelium (arrows), methanotrophs with low pmoA expression levels appear blue (center). (b) Detail of (a), a few thiotrophs in the immediate vicinity of methanotrophs appear yellow, caused by a strong pmoA mRNA FISH signal of the methanotrophic neighbor. (c) m/rRNA FISH of thiotrophic symbionts. Thiotrophs with aprA expression appear yellow close to the ciliated epithelium (arrows), thiotrophs without aprA expression appear red (center). (d) Detail of (c). (e) Horizontal cross-section through a whole mussel in the posterior–anterior axis (juvenile 7). DAPI (red) and pmoA mRNA FISH (green), with gills outlined (white dotted line). The inset in (e) shows a schematic drawing of a juvenile mussel with one shell removed; the red dotted line indicates the sectioning plane of the cross-section shown in (e).

