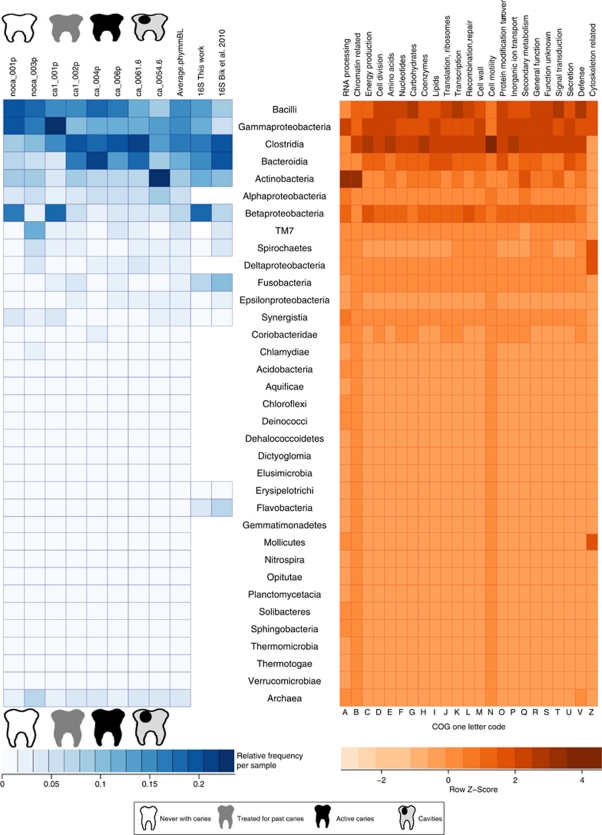
Figure 1.
Bacterial diversity in the oral cavity. The graph on the left shows the relative frequency of different bacterial taxa, based on the assignment of the DNA reads by the PhymmBL software and by 16S rRNA reads extracted from the metagenome, and compared with the PCR results obtained by Bik et al. (2010). The graph on the right indicates the relative contribution of each taxonomic group to the coding potential of the ecosystem, based on the COGs functional classification system. It can be observed that the functional contribution is not equal among taxa.

