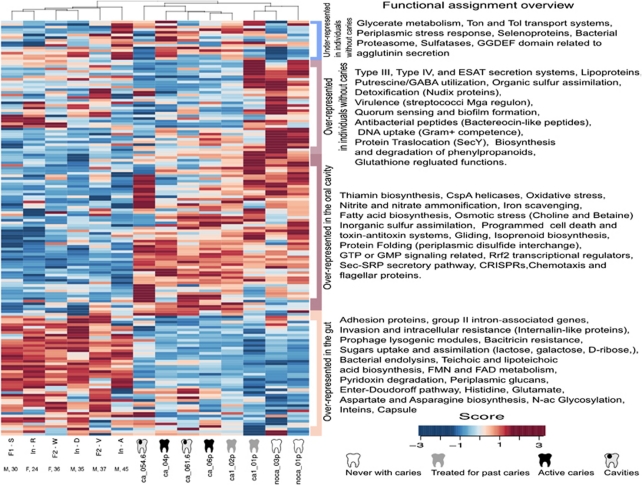
Figure 3.
Functional profiles from oral and adult-gut metagenomic samples. Classification was based on Subsystem hierarchy 2 of MG-RAST. Counts were normalized to the total number of reads per sample and then normalized by function. Blue to red gradient indicates levels of under/over-representation. Large blocks of gene categories are over-represented in each of the two microbiotas, indicating that the gut and the oral cavity are two functionally distinct ecosystems. Within the oral microbiome, some functional roles are over-represented in individuals without caries. A full version of this figure indicating all 101 functional categories is included in Supplementary Figure 6. Sequences from the healthy adult-gut metagenomes were taken from Kurokawa et al. (2007). The age and sex of each individual are indicated below each label.

