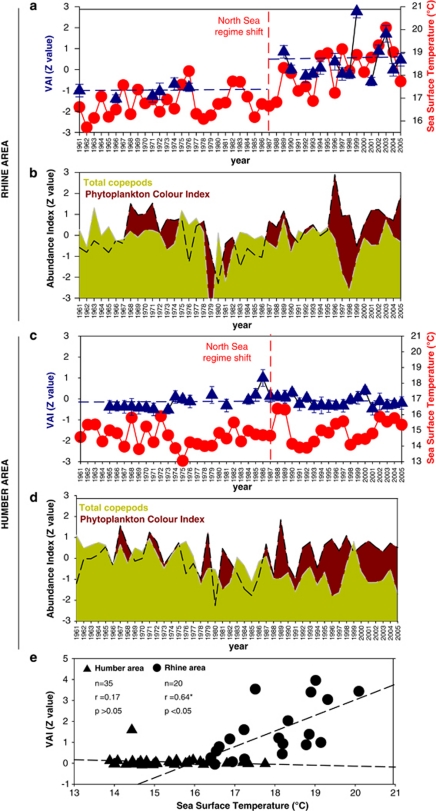
Figure 3.
Relative abundance of Vibrio spp. and levels of environmental variables. Long-term variation in the abundance of Vibrio (a, c) (blue triangles; error bars indicate s.d., n=5), SST (a, c) (red circles), phytoplankton colour index (b, d) and total copepods (b, d) for 1961–2005 off the Rhine and Humber estuaries in the North Sea. Vertical red line=regime shift step change in temperature after 1987 (Kirby et al., 2007). Horizontal blue lines=average standardised Vibrio relative abundance index (VAI) values for the two periods, –0.94 s.d. (1961–1976) and +0.4 s.d. (1989–2005) for the Rhine area and –0.13 s.d. (1965–1987) and −0.13 s.d. (1988–2005) for the Humber area. (e) The Pearson correlation analysis between Vibrio abundance and SST in the North Sea (Pearson's correlation on pooled data; n=55; r=0.27*; P<0.05). Z values are obtained by subtracting the population mean and dividing the difference by the s.d.

