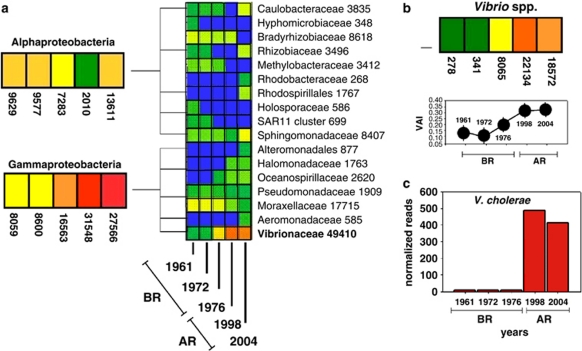
Figure 4.
16S rDNA pyrosequencing-based comparative analysis of the microbial community from historical CPR samples. Comparative analysis of 16S rDNA pyrosequencing data for dominant Alpha- and Gammaproteobacteria groups are shown for CPR samples collected in 1961, 1972, 1976, 1998 and 2004 off the Rhine Estuary. A heat map is shown, where the numbers of normalised reads taken by each taxon in each year are represented as colours (cold-to-hot colour representing low to high number of reads). The cumulative number of normalised reads across the different years is also shown for each taxon (Mitra et al., 2009). AR=after regime shift; BR=before regime shift. (a) The tree is collapsed to the ‘family' level; (b) results for the Vibrio genus, Vibrio relative abundance index (VAI) index is reported for comparison; (c) number of normalised read sequences showing >95% identity to V. cholerae (see also Supplementary Figure S3).

