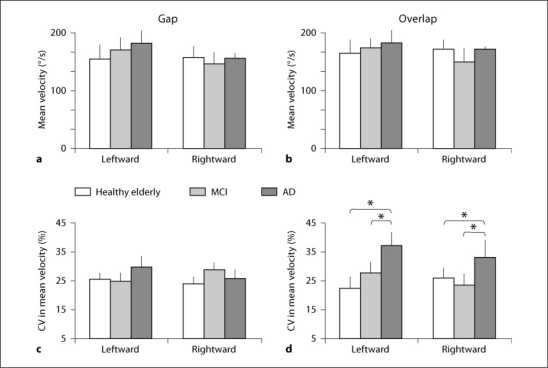
Fig. 7.
Group-averaged mean velocity (a, b) and group mean CV in mean velocity gain (c, d) in gap and overlap tasks for primary saccade for each direction in healthy elderly, MCI and AD patients. Vertical lines are standard deviations. Note: higher CV in mean velocity for AD patients than for healthy elderly and MCI subjects: * p < 0.05.

