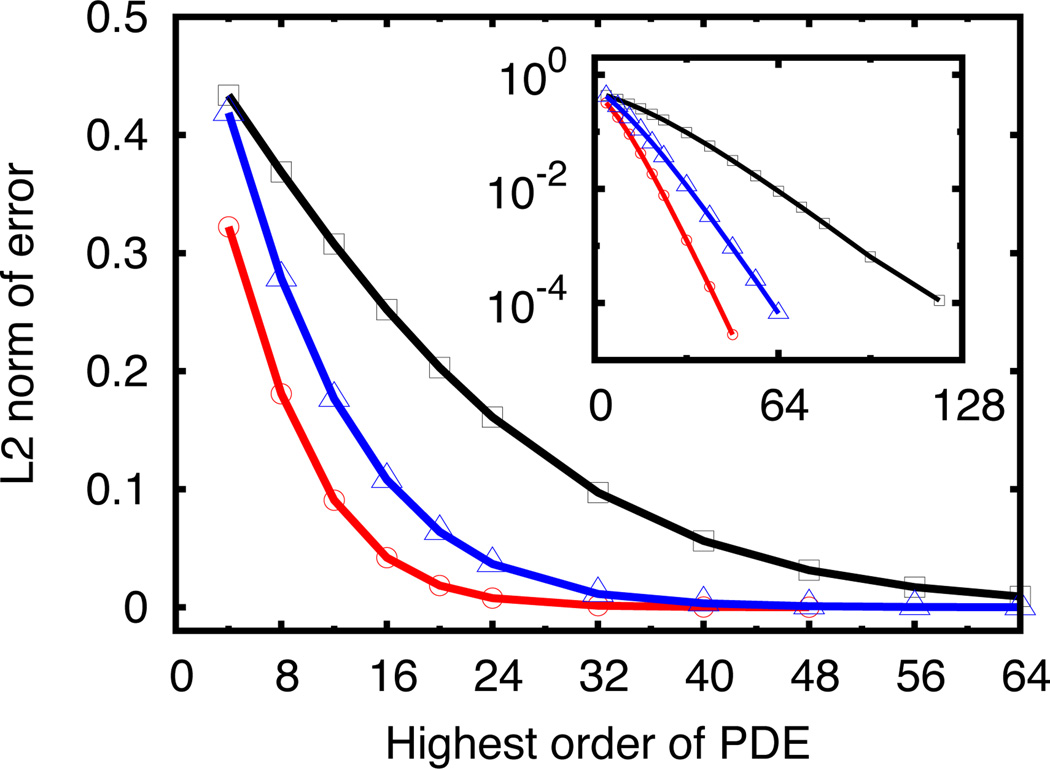
Figure 4.
Extraction of higher frequency mode sin(mx) from the original signal sin(x) + sin(mx). In the main window of the figure, x-axis is the highest order of PDE employed in the PDE transform algorithm, and y-axis is the L2 norm error of the high frequency mode numerically extracted compared with the exact values of sin(mx). Three different signals of sin(x) + sin(1.1x), sin(x)+sin(1.2x) and sin(x)+sin(1.3x) are decomposed by the PDE transform algorithm, and their numerical results are shown by black square, blue triangle and red circled curves. The first signal of sin(x)+sin(1.1x) with closest overlapping modes requires much higher order of PDEs to be included in the PDE transform algorithm in order to achieve the same level of accuracy (or error) as for the other two signals. For the purpose of alternative viewing and better understanding, numerical errors are also plotted in log-scale as in the embedded smaller subfigure in the main window above. It is clearly observed that the PDE transform algorithm with higher order PDE achieves higher accuracy and better resolution in differentiating two modes with closely adjacent frequencies.

