
Figure 2.
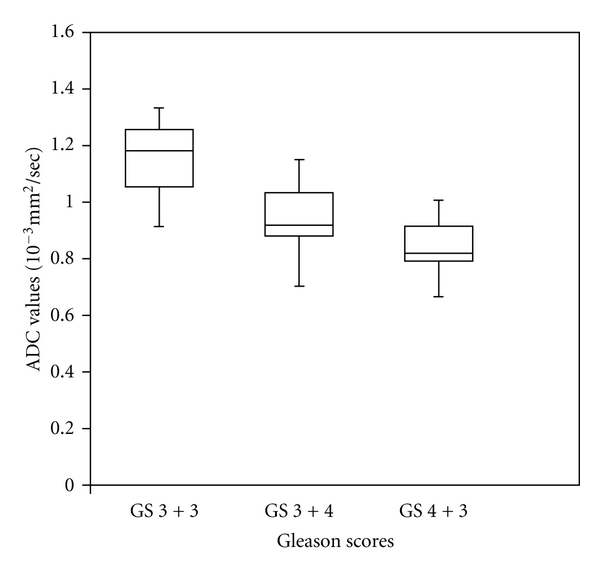
Box-Whisker plots of ADC values of Gleason score (GS) 3 + 3, (GS) 3 + 4 and (GS) 4 + 3 patients. The center horizontal line indicates the median.
Official websites use .gov
A
.gov website belongs to an official
government organization in the United States.
Secure .gov websites use HTTPS
A lock (
) or https:// means you've safely
connected to the .gov website. Share sensitive
information only on official, secure websites.
Box-Whisker plots of ADC values of Gleason score (GS) 3 + 3, (GS) 3 + 4 and (GS) 4 + 3 patients. The center horizontal line indicates the median.