
Figure 4.
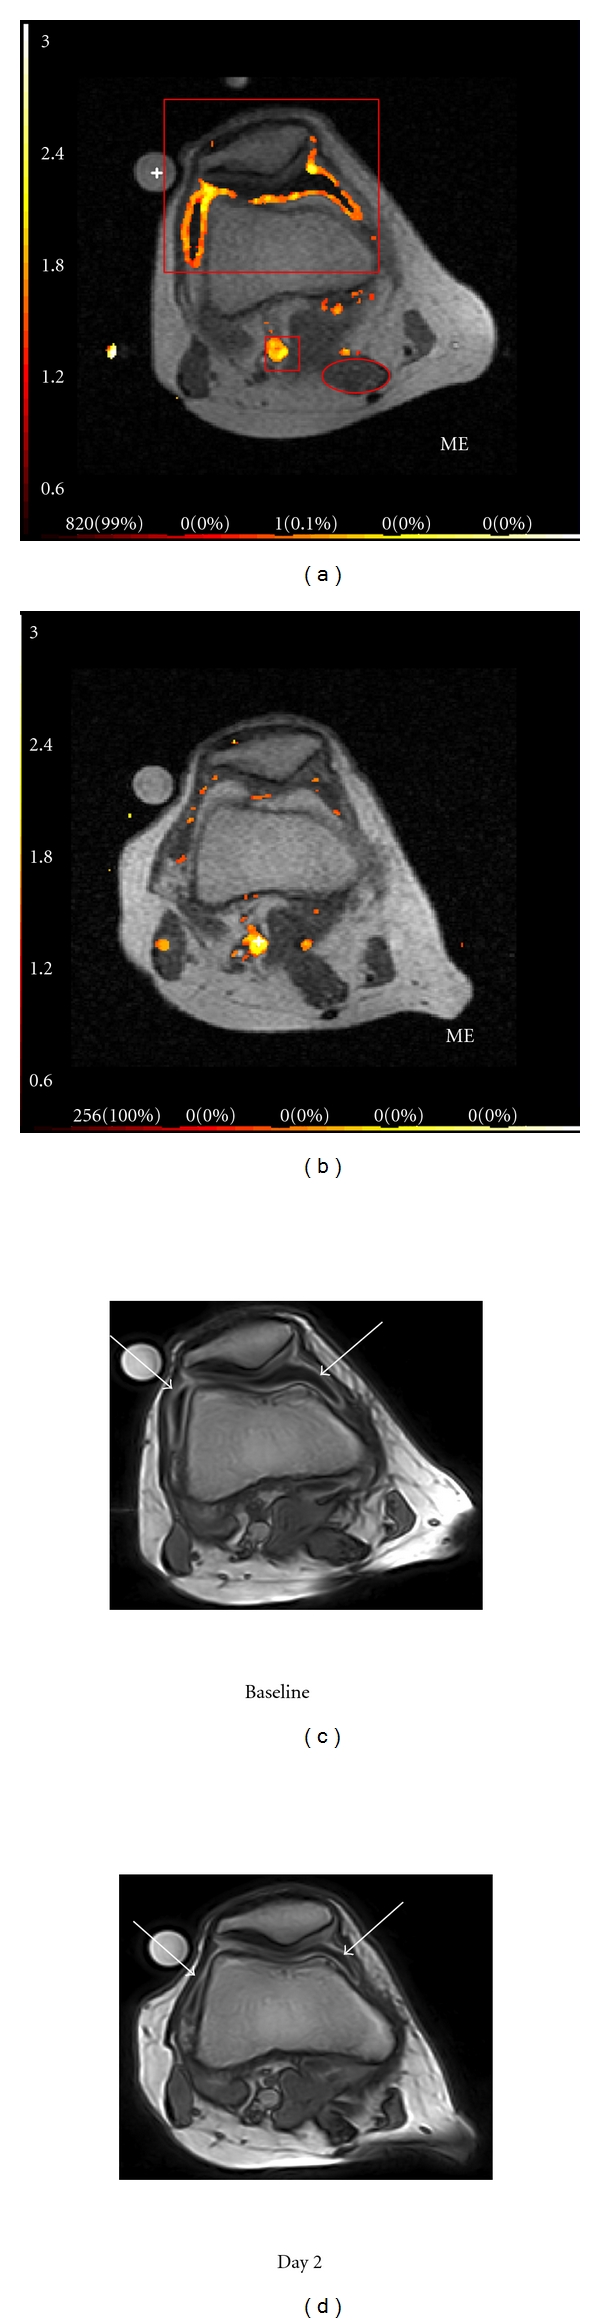
Parametric maps derived from DCE-MRI data maximum enhancement (ME) (a, b) and the corresponding static postcontrast 3D T1-w gradient echo images (c, d) from baseline and day 2. Arrows pointing at the enhancing synovial membrane in the post contrast images (c, d). Examples of the applied ROIs are shown in red in (a) representing the synovial ROI in front of the knee, the popliteal artery ROI behind the knee, and the muscle ROI (oval circle).