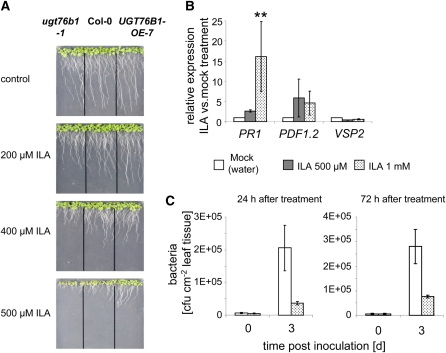
Figure 11.
The Direct Effect of Exogenously Applied ILA.
(A) Root growth inhibition phenotype of ILA inversely correlates with UGT76B1 expression. Photographs were taken 10 d after sowing the seeds on plates containing 0, 200, 400, and 500 μM ILA.
(B) Defense marker gene expression in Col-0 plants after ILA treatment. Transcript levels of PR1, PDF1.2, and VSP2 in leaves of 4-week-old Col-0 plants 24 h after ILA or water treatment were quantified by qRT-PCR. Values are relative to the expression 24 h after mock (water) treatment. Graph represents the mean and sd of three biological replicates. **P value < 0.01.
(C) Bacterial growth in Arabidopsis leaves of wild-type plants sprayed with water (white) or 1 mM ILA (dotted) before infection. Plants were inoculated with 5 × 10⁵ cfu mL−1 of Ps-avir 24 or 72 h after treatment, and bacteria (cfu cm−2) were quantified 0 and 3 d after inoculation. The graphs represent the means and sd of three replicates.
[See online article for color version of this figure.]

