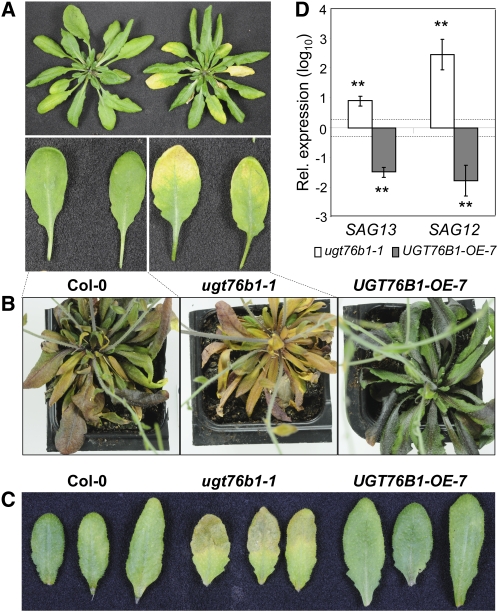
Figure 2.
Senescence Phenotypes of ugt76b1 Knockout and UGT76B1 Overexpression Lines.
(A) Natural senescence in 6.5-week-old Col-0 and ugt76b1-1 mutant plants.
(B) Natural senescence in 9-week-old Col-0, ugt76b1-1, and UGT76B1-OE-7 plants.
(C) Dark-induced senescence in Col-0, ugt76b1-1, and UGT76B1-OE-7 plants. Excised leaves from 5-week-old plants were kept in water and darkness for 5 d. The second knockout line, ugt76b1-2, showed the same senescence-related phenotype (see Supplemental Figures 3A and 3B online).
(D) Relative quantification of senescence-associated marker genes SAG13 and SAG12 in 7-week-old wild-type, ugt76b1-1, and UGT76B1-OE-7 plants (leaves 7 to 9). Transcript levels were normalized to UBIQUITIN5 and S16 transcripts; levels relative to Col-0 plants are displayed. Arithmetic means and standard errors from log10-transformed data of two experiments (each based on three independent replicates) were calculated. Asterisks indicate significance of the difference to the wild-type line; **P value < 0.01. The dashed lines indicate a twofold change.

