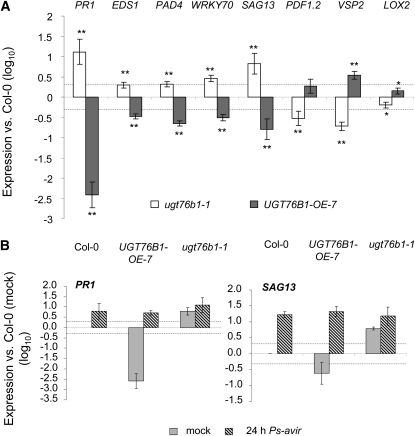
Figure 4.
Defense Marker Gene Expression in ugt76b1-1 and UGT76B1-OE-7 Plants before and after Pathogen Infection.
(A) Gene expression of PR1, EDS1, PAD4, WRKY70, SAG13, PDF1.2, VSP2, and LOX2 in 5-week-old ugt76b1-1 and UGT76B1-OE-7 measured by qRT-PCR. Expression levels were normalized to UBIQUITIN5 and S16 transcripts; levels relative to Col-0 plants are displayed. Arithmetic means and standard errors from log10-transformed data of two experiments each consisting of three independent replicates were calculated using ANOVA. Asterisks indicate significance of the difference to the wild-type line; **P value < 0.01 and *P value < 0.05.
(B) Transcript levels of PR1 and SAG13 in 5-week-old wild-type plants 24 h after infection (5 × 10⁵ cfu mL−1 Ps-avir) measured by qRT-PCR. Values are relative to expression 24 h after mock treatment and log10 transformed. Bars represent the mean and standard deviation of three replicates.
The dashed, horizontal lines indicate a twofold change.

