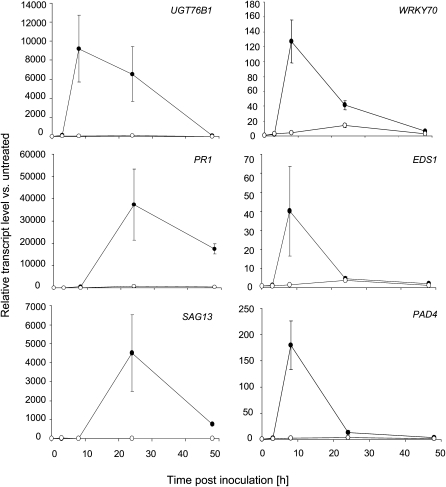
Figure 7.
qRT-PCR Expression Profiles of UGT76B1, WRKY70, EDS1, and PAD4 Induction after Infection with Avirulent P. syringae.
Transcript levels were quantified at the indicated time points after inoculation with Ps-avir (closed circles) and mock (10 mM MgCl2; open circles) treatment. The transcript level (relative expression) was normalized to the transcript abundance of UBIQUITIN5 and S16 genes. Values correspond to the mean and standard deviation of triplicates. The experiment was repeated with similar results.

