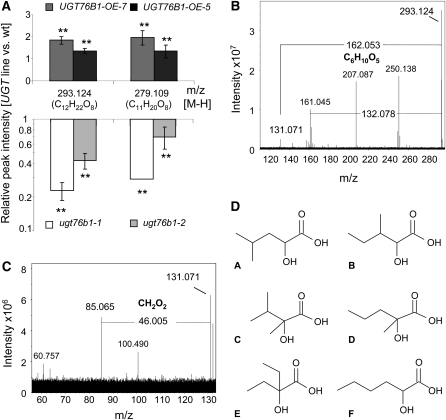
Figure 9.
Nontargeted Metabolome Analysis of UGT76B1 Overexpression and ugt76b1 Knockout Lines.
(A) Metabolic changes found in roots of two independent knockout lines and two independent overexpression lines compared with the respective wild type (wt). Means and standard deviation of three independent biological replicates with two technical replicates each are displayed. m/z 279 was nearly undetectable and undetectable in ugt76b1-2 and ugt76b1-1, respectively. Therefore, a default value for the ugt76b1-1 peak was used for calculating the relative intensity (see Methods). Asterisks indicate significance of the difference to the wild type; **P value < 0.01. The predicted molecular formulae are indicated. The experiment was independently repeated with similar results.
(B) Fragmentation pattern of m/z 293. The loss of m/z 162 confirmed the presence of a hexosidic moiety. Other major peaks at m/z 207 and 250 could be unequivocally excluded as m/z 293–derived fragments; they were originating from electrical noise and from an N-containing contaminant, respectively. By contrast, m/z 161 was in agreement with a radical anion of deprotonated hexose, which was directly produced from m/z 293.
(C) Further in-cell fragmentation led to the elimination of CH2O2 (formic acid), which restricted the nature of the aglycon to α-hydroxy carboxylic acid isomers.
(D) Six possible isomeric molecular structures of the aglycon C6H12O3.

