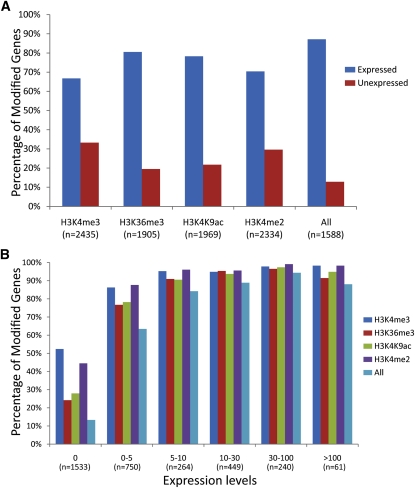
Figure 2.
Correlation between Gene Expression and Histone Modifications.
(A) Association of each of the four histone modifications (H3K4me3, H3K36me3, H3K4K9ac, and H3K4me2) with expressed and nonexpressed genes based on RNA-Seq data. Bars indicate the percentage of all expressed (blue) or unexpressed (red) genes enriched for this modification.
(B) Genes at different expression levels and their association with each of the four histone modifications. All genes were divided into six categories based their expression value FPKM (FPKM = 0, 0 to 5, 5 to 10, 10 to 30, 30 to 100 and >100). “All” indicates genes associated with H3K4me3, H3K36me3, H3K4K9ac, and H3K4me2 concurrently.

