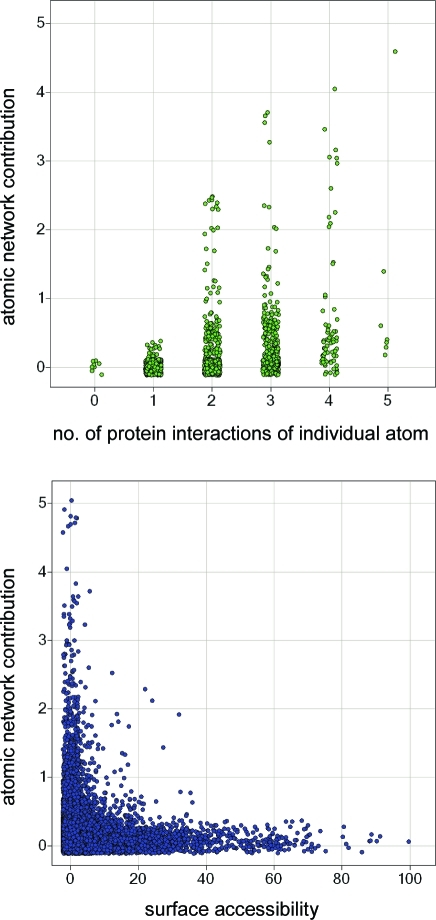
Figure 10.
Atom-based Scorpion scores were calculated for a subset of 12 139 protein–ligand complex structures taken from Proasis2. For this subset, the top graph shows the distribution of network contributions vs the number of protein interactions of individual fluorine atoms (1932 data points). The bottom graph shows the distribution of network contributions vs the solvent surface accessibility of individual nitrogen atoms (21 273 data points). Some jitter is applied to the visualizations to better differentiate overlapping data points.

