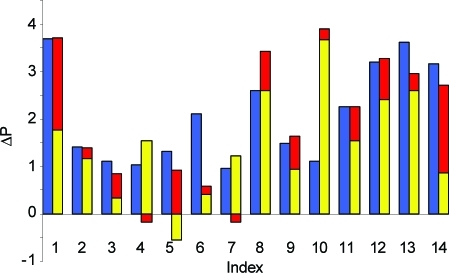
Figure 6.
Comparison of experimental (blue) vs predicted (red, network contribution; yellow, non-network contribution) logarithmic affinity differences ΔP for the activity cliff training set IV (Table 5). Predicted affinity differences are the sum of the respective yellow and red bars.

