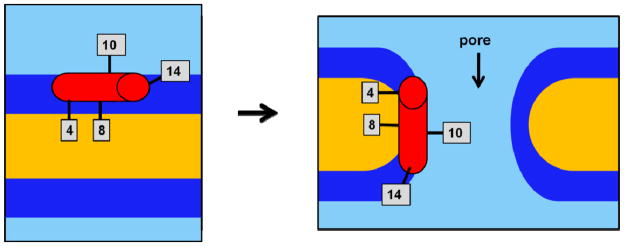
Figure 6.
Cartoon representation of the positioning of CM15 during pore formation in BPL bilayers, with IR label sites indicated. Graphical distances do not correspond to any physical scale. Light blue=aqueous solution, dark blue=polar head groups, yellow=hydrophobic lipid chains, red cylinder=CM15 helix.

