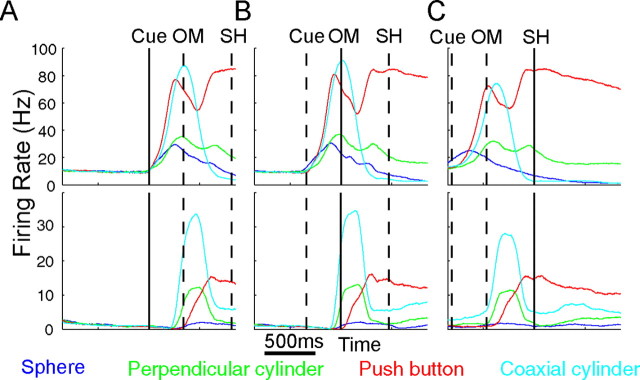
Figure 6.
Variation in spike firing rates. Firing rate histograms of two SUs isolated from two different arrays (top vs bottom) in monkey Y are shown for each of the four movements. Data from multiple successful trials of each movement were averaged separately aligned (solid vertical line at center) on the cue (A), OM (B), or SH (C). The average time of the other behavioral events is indicated by dashed vertical lines in each frame. Movement-dependent variations were prominent for each unit but also differed between units. Variation dependent on movement type also was evident in population averages (data not shown).

