
Figure 3. Classification results.
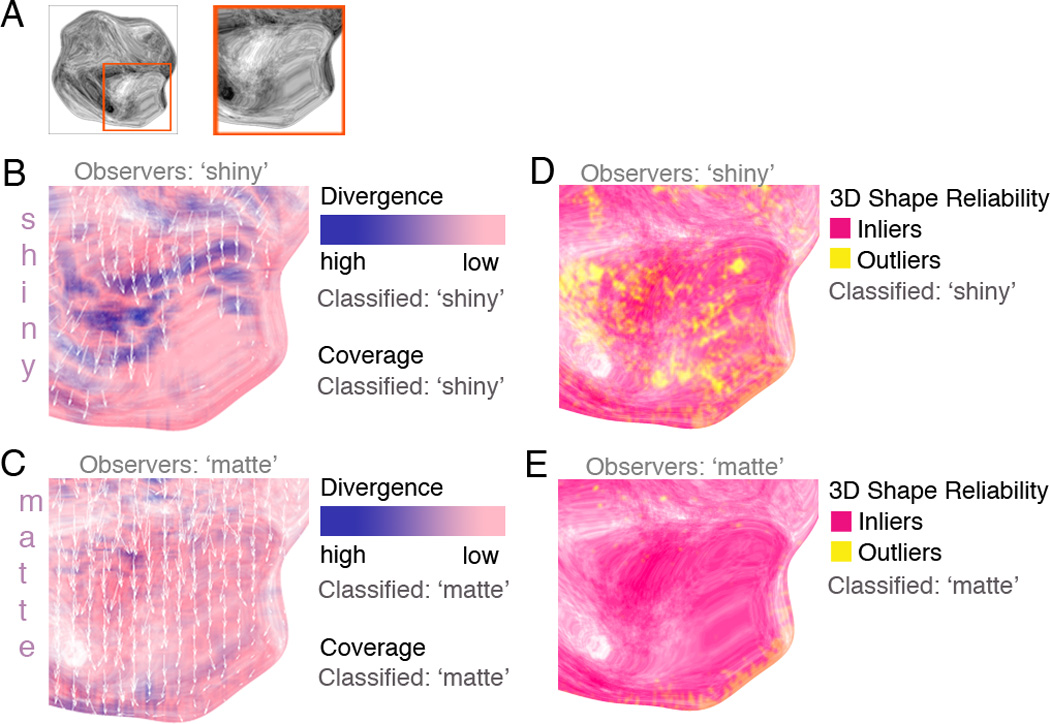
(A) A sample stimulus as well as a partial, close-up view on which classification results for the behavioral stimulus set are illustrated.
(B) White arrows indicate regions in which flow vectors could be computed over a distance of three frames. Classification results for divergence and coverage are shown to the right.
(C) Same as (B) but for matte objects.
(D) Pixels classified as inliers are those which show a flow pattern consistent with a 3D rigid motion. (E) Same as (D) but for matte objects.