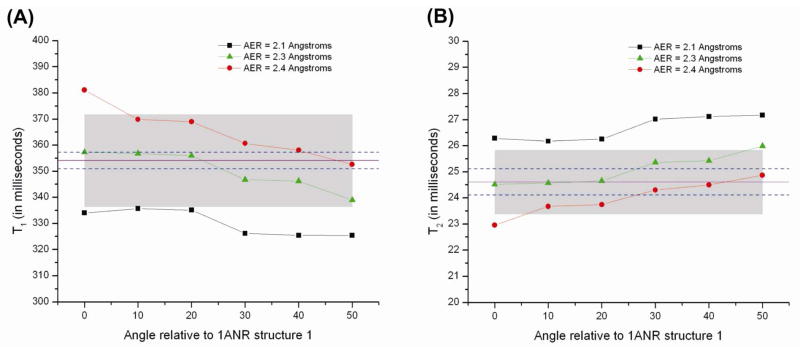
Figure 6.
A) T1 and B) T2 values derived using equation 25 for the “30 degree series” (Figure 3B) as a function of AER and CE rotation angle. The solid purple line and dashed blue lines represent the experimental values and error bars respectively of A) T1 = 354 ± 3.2 ms, and B) T2 = 24.6 ± 0.5 ms. The shaded regions in both panels represent error regions of ±5%.

