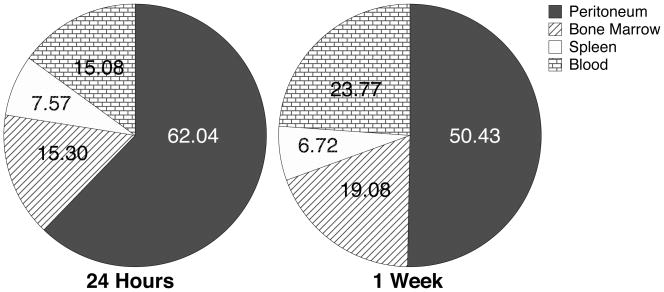
Fig. 3.
Tissue distribution of eGFP+ cells 24 hours and one week after transplantation. 1.1×04 eGFP+CD117+CD150+ murine donor cells were transplanted i.p. into Balb/c mice. Peritoneal cells, bone marrow, spleen and blood were harvested at the indicated time points. Total numbers of viable eGFP+ cells in each of these tissues, based on cell recoveries and flow cytometric analyses, were used to calculate the distribution of donor cells. Results represent the mean of n = 2 at each time point.

