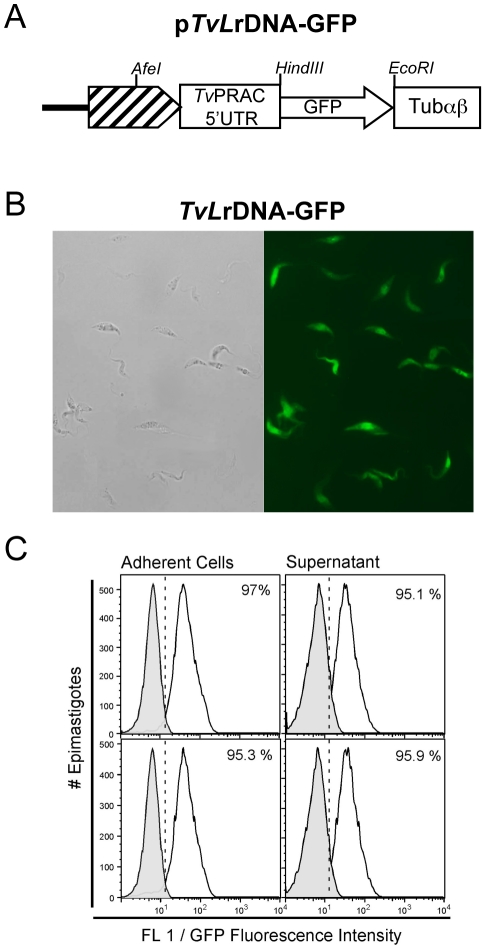
Figure 8. Validation of stably transformed pTvLrDNA-GFP parasites.
Schematic representation of pTvLrDNA-GFP vector construct (A); TvLrDNA-GFP parasites from axenic culture supernatants were examined under phase contrast (left panel) and epifluorescence (right panel) microscopy (B). Parasite populations obtained from two independent transfections were cultured and analyzed by flow cytometry. Dead cells were excluded from the acquisition by gating out propidium iodide-stained cells. Parasites were further gated on forward-light scatter/side-light scatter combined gate and the histograms represent the frequency of GFP-expressing TvLrDNA-GFP cells (%) as compared to WT, non transformed, control parasites (gray curves) (C).

