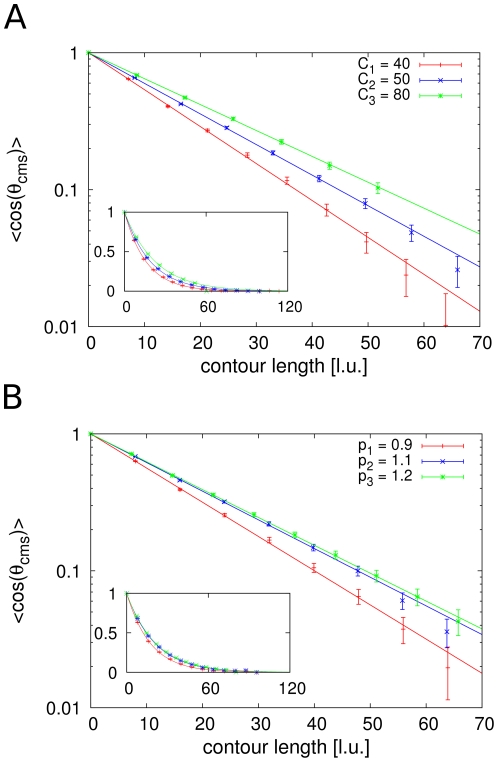
Figure 6. Directional correlation functions for model chromatids with varying parameters.
The chain length for all configurations is  . Error bars represent the standard error. A. For fixed mean loop concentration
  we can see that the stiffness increases with the cutoff length
  . Larger cutoff lengths result in thicker chromosomes and in turn less flexibility. B. Shown are results for
  and different mean loop concentrations. An increased number of cross-links is associated with a more densly packed chromosome. Thus, the distance between loops is decreased and the repulsive forces between them are stronger. Consequently higher bending rigidities are obtained.

