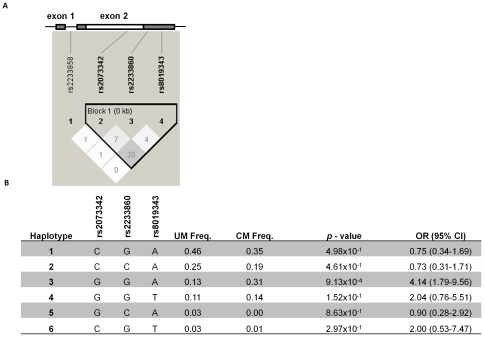
Figure 1. Location of the studied SNPs in RNASE3, linkage disequilibrium (LD) patterns and haplotype association analysis.
A) A shematic of the region of the RNASE 3 gene (NM_002935.2) and LD plot of the respective SNPs visualised using Haploview v4.2. At the top of the LD plot, the two exons are shown with the intron joining them. Untranslated regions of the exons are indicated by shadings. The LD plot shows pairwise r2 values (×100) given in the squares for each comparison between the SNPs. White squares represent r2 values equal to 0. Different shades of grey represent r2 values between 0 and 1. B) Haplotype associations with susceptibility to cerebral malaria (CM) compared to uncomplicated malaria (UM). Odds ratio (OR) and 95% confidence intervals (CI) were determined using multivariate logistic regression controlling for age and gender. The reference groups in the multivariate logistic regression analyses were those without the respective haplotypes. Haplotype 3 (GGA) was significanlty associated with susceptibility to CM.

