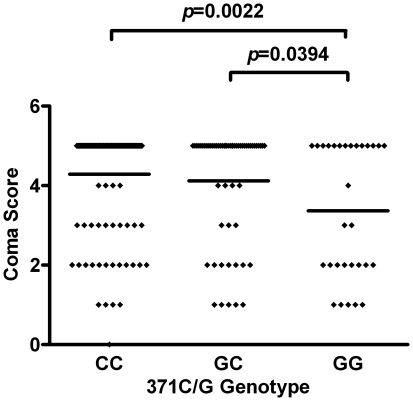
Figure 2. Association of c.371G>C genotypes with coma score in the entire patient population studied.
Coma score distribution among individuals with 371 (GG, GC and CC) genotypes is shown. Comparisons that yielded statistical significance are indicated with horizontal lines linking the respective groups at the top of the plots with the p – value stated. P-values were determined by Mann Whitney test and horizontal lines within plots represent the median of the distribution.

