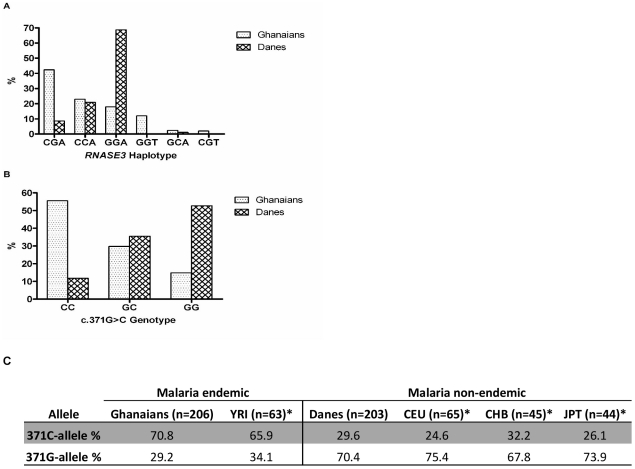
Figure 3. RNASE3 haplotypes, c.371G>C genotypes and alleles distribution in malaria endemic (Ghanaian) versus non-malaria (Danish) populations.
A) Distribution of haplotypes defined by the three SNPs (rs2073342, rs2233860 and rs8019343) as from block 1 in Figure 1A in the two populations. B) c.371G>C genotype distribution in all Ghanaian subjects compared to Danes. C) c.371G>C allelic distribution in the two populations.

