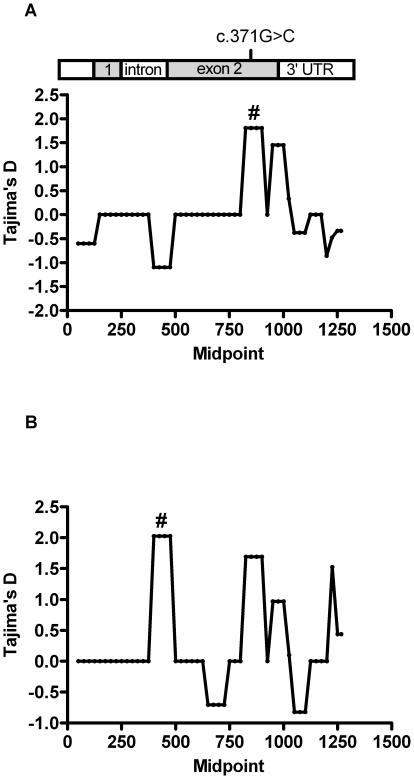
Figure 4. Tajima's D index .
Sliding window analysis of Tajima's D index across the Ghanaian (A) and Danish (B) RNASE3 sequences. Bar at the top shows the sequence region analyzed (nucleotides 1–1183) and the positions of the SNP. Window sizes used were 100 bp with a 25-bp step size. Windows that gave a significant D value p<0.10), are indicated above the relevant window midpoint by a hash (#).

