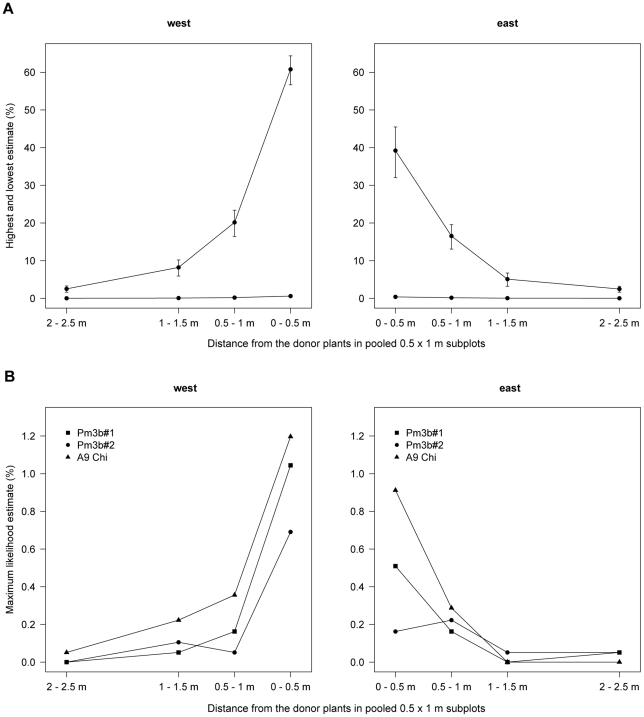
Figure 1. Cross-pollination of GM wheat over short distances and in two wind directions.
A: Upper and lower boundaries of cross-pollination rate estimates (mean±1 SE, back-transformed from logit scale) for western and eastern distance subplots. Data from all lines were pooled. B: Maximum likelihood estimate of cross-pollination rate for the western and eastern subplots for the lines Pm3b#1, Pm3b#2 and A9 chi. These estimates indicate cross-pollination rates between 1.2% and 0.16% in the closest and 0.05% and 0.0% in the farthest subplots.

