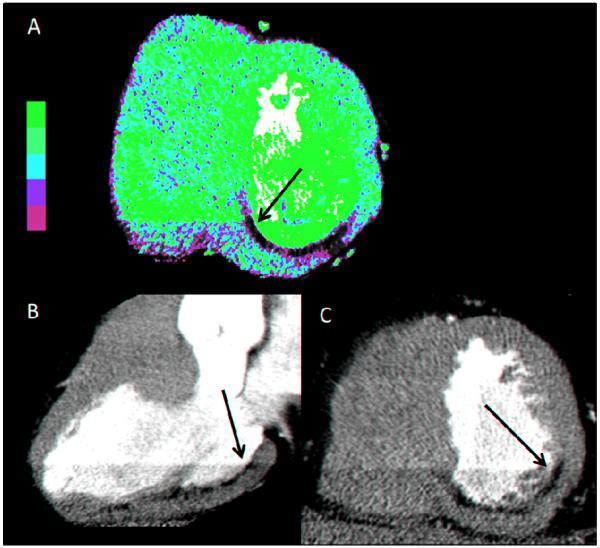
Figure 2.
This is a representative example of a subject with myocardial infarction. The arrow indicates hypo-enhancement crossing a phase delineated boundary which meets criteria for abnormal CTP. A – Color perfusion map in short axis showing inferior hypo-enhancement. B – Gray scale vertical long axis (3 chamber) view showing infero-lateral hypo-enhancement. C- Gray scale short axis view showing inferior and infero-lateral hypo-enhancement.

