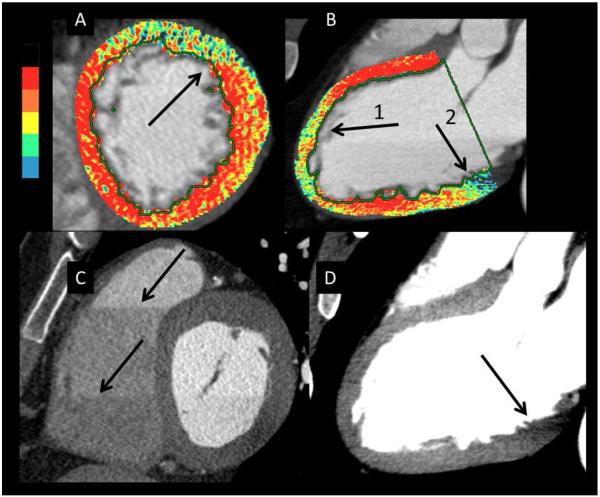
Figure 3.
This figure shows several examples of imaging artifacts seen on color and gray scale images designated by arrows. Panels A and C are two different patients and panels B and D are from the same patient. A – Color perfusion image with an anterior artifact with a linear cut-off typical of a stair-step artifact. B- Anterior artifact caused by phase boundary and beam hardening from sternum (Arrow 1). Artifact due to beam hardening from the aorta or spine (Arrow 2). C –Linear boundaries caused by axial slice/stair-step artifacts. D – Gray scale of the color image in panel B. Artifacts in the apical anterior wall are not as evident as the color image (Arrow 1). However, the beam hardening artifact in the basal inferior wall is still evident (Arrow 2).

