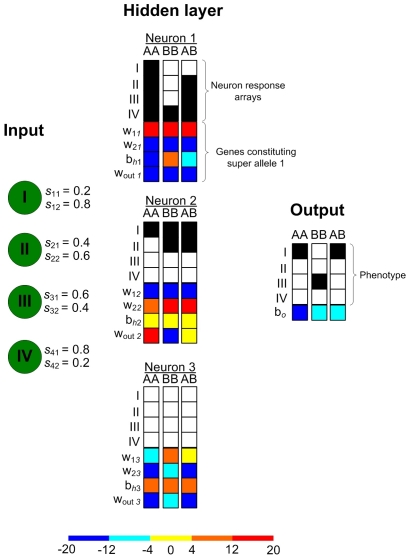
Figure 3. Weights (colour squares) and neural activity (b&w squares) to resources I–IV of the genotypes in the polymorphism.
Niche signal components (sj 1 and sj 2, for resource j = 1≡I,2≡II,3≡III,4≡IV) propagate via weights (w 1k, w 2k) to the hidden neurons (k = 1,2,3). SG1 and SG2 code for these weights, the bias weight (bhk), and the output weight (w out k), which settings are represented by colours (bar at the bottom). The weights (row 5–8) and corresponding response (row 1–4; black: response >0.5; white: response <0.5) are given for genotypes (AA, AB, BB) and niches I–IV. For the output neuron, the fifth row represents the bias weight bo.

