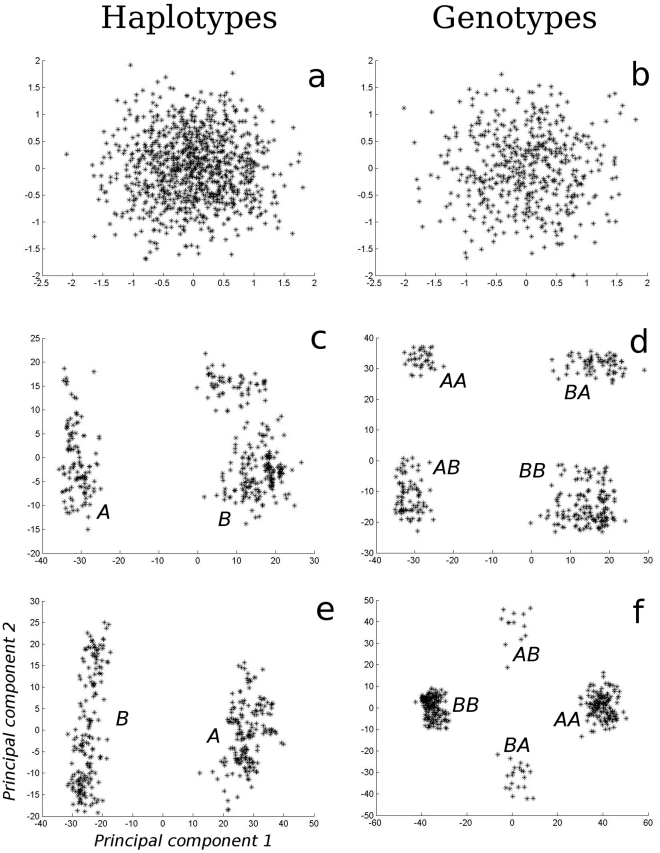
Figure 4.Principal. component analysis (PCA) on haplotypes (left column) and genotypes (right column) at different stages of the simulation.
The initial condition is an even scatter of haplotypes (a). and genotypes (b). At generation 20,000 two haplotypes (A, B) and three genotypes (AA, AB, BB; AB and BA are separated only for reasons of how we represent genotype information) has evolved under random mating (c and d). The genotypes at generation 30,000 prevail after invasion of assortative mating (e and f,), with heterozygotes now more rare. Principal components are unique to each panel and hence cannot be compared across panels. Data is taken from the same simulation as in Fig. 6.

