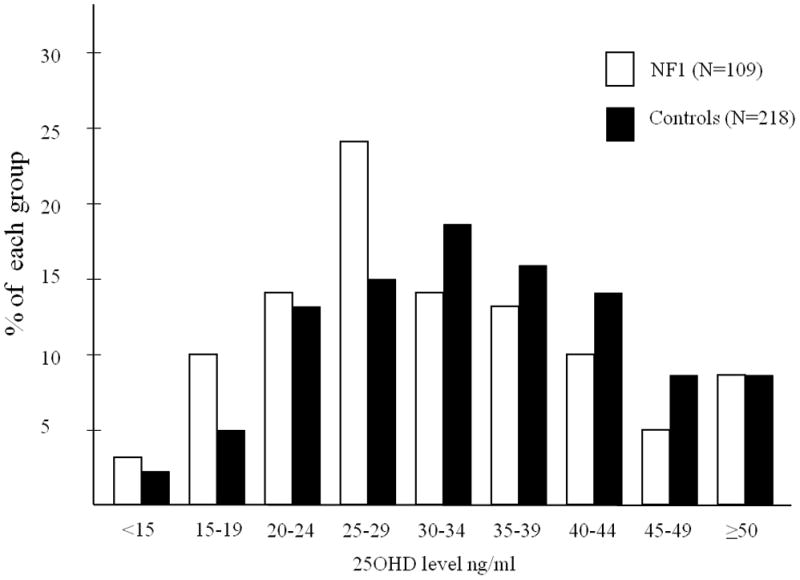
Figure 1.

Bar graph of the percent of individuals with specific levels (intervals of 4 ng/ml) of 25OHD concentrations within each neurofibromatosis type 1 (NF1) and control group. Black bars represent control individuals and white bars represent individuals with NF1.
