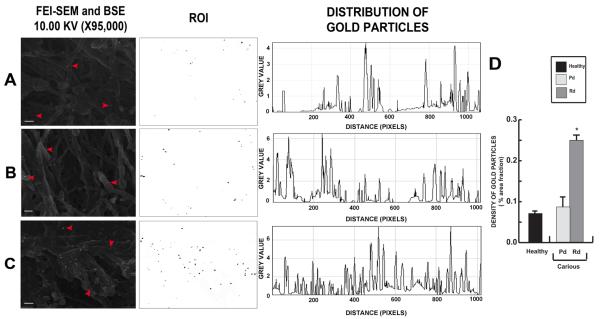
Figure 4.
Representative images of immunogold-labelling of DSP on fixed partially demineralized dentin. (A) DSP labelling (arrowheads) were observed on the collagen fibrils in dentin from healthy tooth with a random distribution pattern. (B) In carious teeth DSP localisation in Pd closely follows that observed in dentin from healthy teeth. (C) Rd demonstrates the densest pattern of distribution. Scale bars 200 nm. Bar chart demonstrating the density of DSP in terms of percentage of area fraction. Rd area has the densest DSP labelling compared to Pd area and dentin from healthy teeth (n=12). The data for density of DSP labelling are expressed as mean values ± SD. * P ≤ 0.05.

