Figure 6.
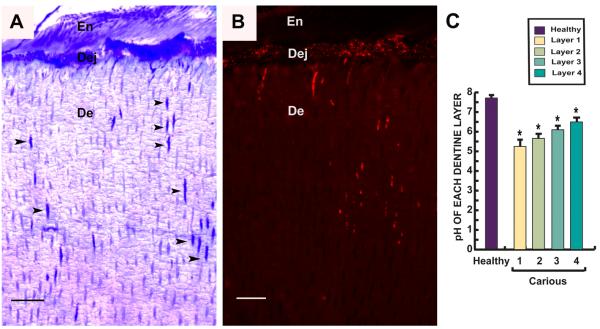
Semi-thin resin sections perpendicular to tooth axis of a carious tooth showing invasion of bacteria from enamel (En) through the dentin-enamel junction (Dej) and into dentin (De). (A) Toluidine blue stain demonstrates invasion of bacteria along dentinal tubules (arrowheads). (B) Fluorescence in situ hybridization (FISH) with a universal 16SrRNA bacterial probe. Red fluorescence shows bacteria accumulating along the Dej and in dentinal tubules. Scale bar 30 μm. (C) Bar chart demonstrates pH gradient in different layers (Fig. 5A) from carious teeth (n=20) compared to healthy teeth (n=14). In the area of the infected soft carious lesion (layers 1&2), the pH was low increasing progressively in the deeper layers. Values depicted mean values ± SD. *P≤ 0.05

