Figure 7.
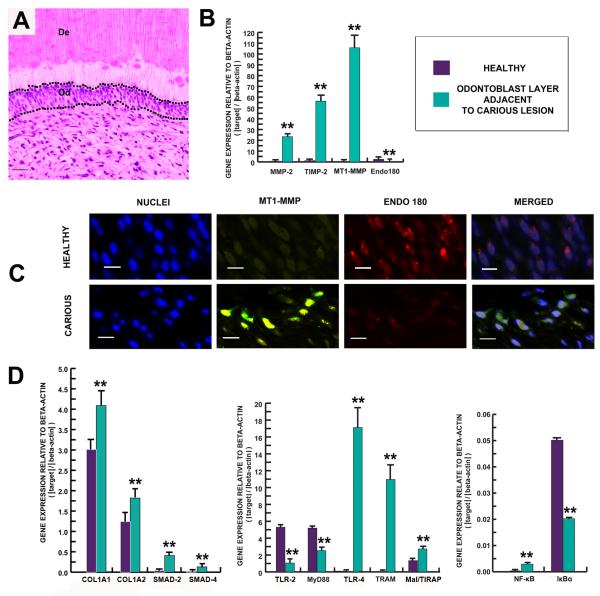
The synthetic activity of the odontoblast layer changes in response to carious stimuli. (A) Toluidine blue staining demonstrates micro-dissection of the odontoblast layer (Od). Scale bar 20 μm. (B) Bar chart demonstrating up-regulation of MMP-2, TIMP-2 and MT1-MMP while Endo180 was down-regulated. (C) Demonstration of MT1-MMP and Endo 180 expression in the odontoblast layer. Odontoblast nuclei were stained with DAPI (first and fourth panels). Sections were dual stained for MT1-MMP (green fluorescence) and Endo 180 (red fluorescence). MT1-MMP labelling was more intense in the odontoblastic layers from carious teeth (second panel). Yellow fluorescence represents coincidence of MTP1-MMP and Endo 180 (second panel). In contrast, Endo 180 labelling was more intense in the odontoblast layer from healthy teeth (third panel). Scale bar 30 μm. (D) Bar chart demonstrating relationship of gene expression profiles related to detection of infection, signal transduction and mineralization. Gene expression for TLR-4, TRAM, Mal/TIRAP, NF-κB, SMAD-2,-4, COL1A1 and COL1A2 were observed to be significantly up-regulated, while gene expression levels for TLR-2, MyD88 and IκBα were down-regulated in the odontoblast layer of carious teeth. Levels of mRNA were normalized against ACTB. All values depict means ± SD (n=6). *P ≤ 0.05; ** P ≤ 0.02.

