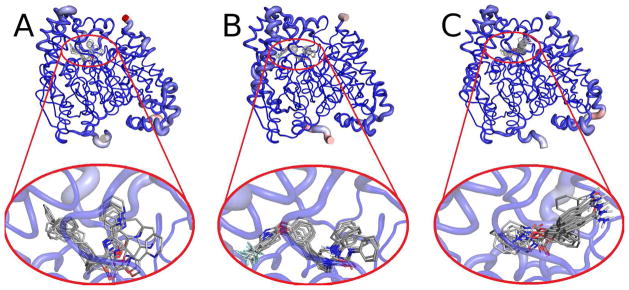
Fig. 2.
Average backbone structure for MD snapshots from (a) 2WJ1, (b) 3LJ6, and (c) 3LJ7. A red, thicker tube indicates greater RMSD across the ensemble, whereas a blue, narrow tube shows limited flexibility. The oval indicates the substrate-binding site region, and a close-up of the region is shown below.

