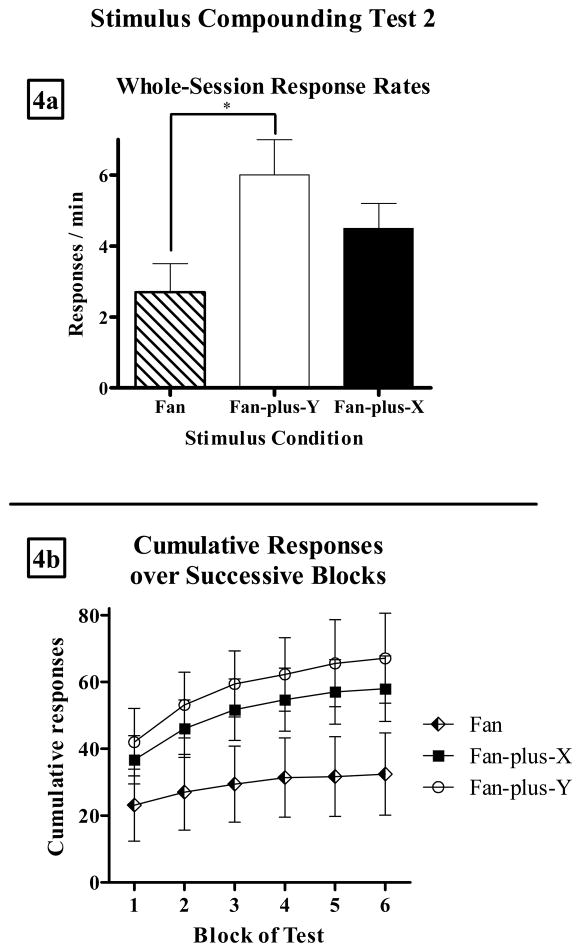
Figure 4.
(a) Mean (±SEM) whole-session response rates during fan alone (striped bar), fan-plus-Y (white bar), and fan-plus-X (black bar) on Stimulus Compounding Test 2. Asterisk indicates p < 0.05. (b) Mean (±SEM) cumulative responses in fan (diamonds), fan-plus-Y (circles), and fan-plus-X (squares) over the 6 blocks of the test.

