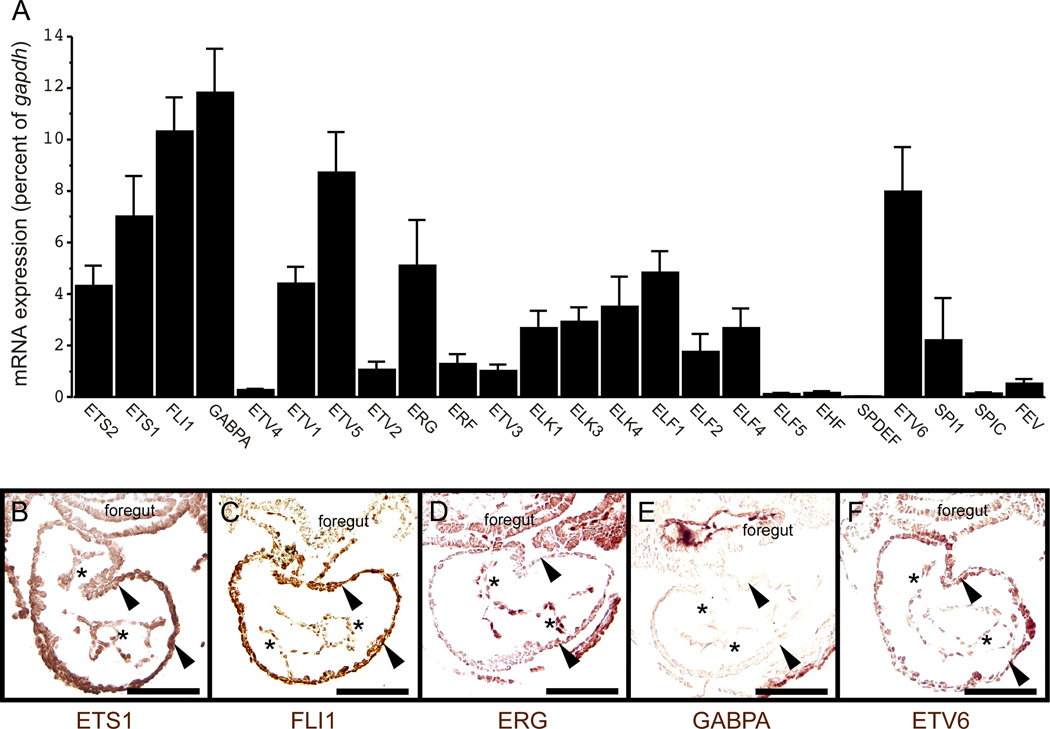
Fig. 7. ETS factor expression profile in embryonic mouse hearts.
(A) Quantification of ETS transcript levels in embryonic hearts at E8.5 by qPCR showed that GABPA, FLI1, ETV5, ETV6, ETS1, ERG, ELF1, ETV1, and ETS2 were the most abundant. Data are expressed as the mean transcript abundance relative to GAPDH from 5 independent tissue isolations and qPCR analyses. Error bars represent SEM. (B–F) Immunohistochemical analyses of wild type E8.5 mouse hearts with antibodies to ETS1, FLI1, ERG, GABPA, and ETV6. FLI1, ETS1, and ERG proteins were expressed in locations with Gata4 G9 enhancer activity (compare panels B–D with Fig. 2G–I). ETS1 and FLI1 proteins were expressed in the endocardium (asterisks in B, C) and myocardium (arrowheads in B, C). ERG expression appeared to be largely restricted to the endocardium (asterisks in D). GABPA protein was strongly expressed in the foregut and largely absent from the embryonic heart (E). ETV6 protein was present in the myocardium (arrowheads in F) with little or no expression detected in the endocardium (asterisks in F). Bars in all panels = 100 µM.

