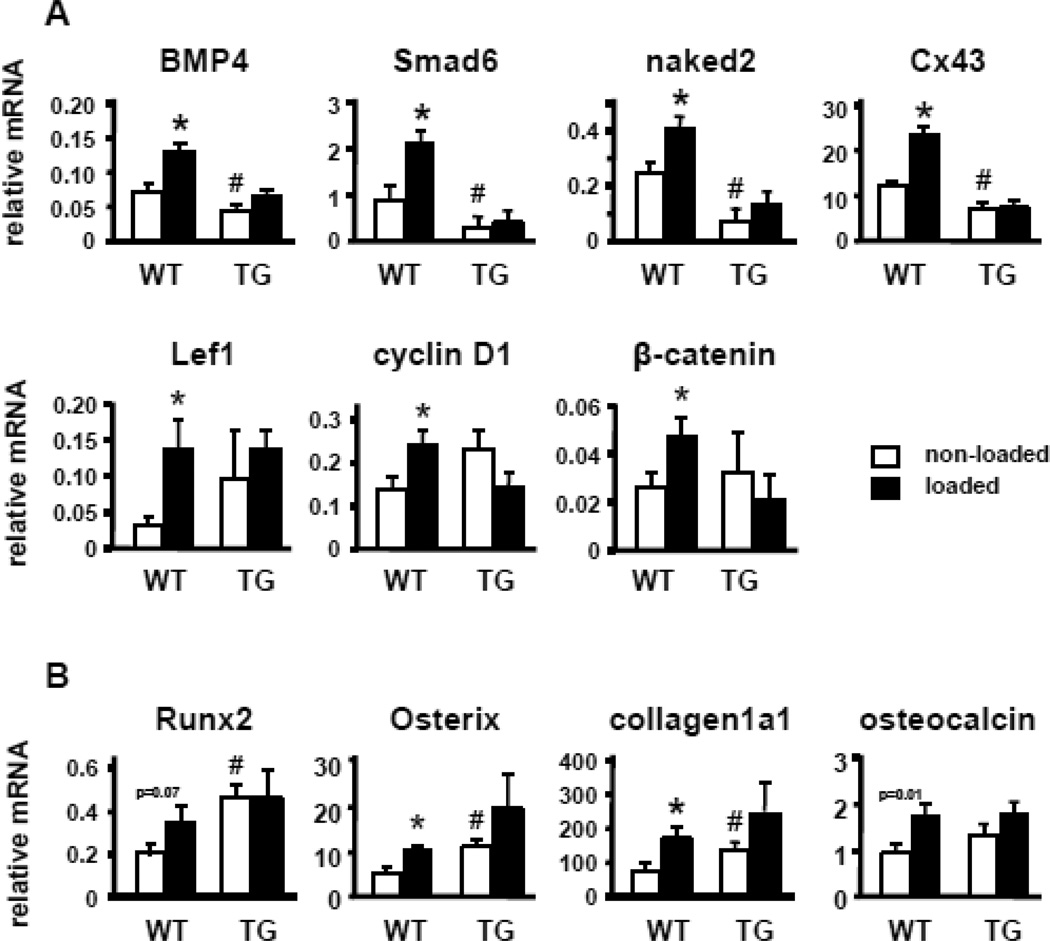
Figure 4. SOST overexpression in osteocytes inhibits basal and load-induced activation of Wnt signaling.
Wnt target genes and osteoblast markers were measured by quantitative PCR and normalized to ChoB expression, in control and loaded ulnae of WT and TG mice. Bars represent means ± SD, n=3. * indicates p<0.05 versus the corresponding non-loaded mice by paired t-Test. # indicates p<0.05 versus non-loaded WT mice by Student’s t-Test. P values indicated for Runx2 and OCN correspond to Student’s t-Test analysis.

