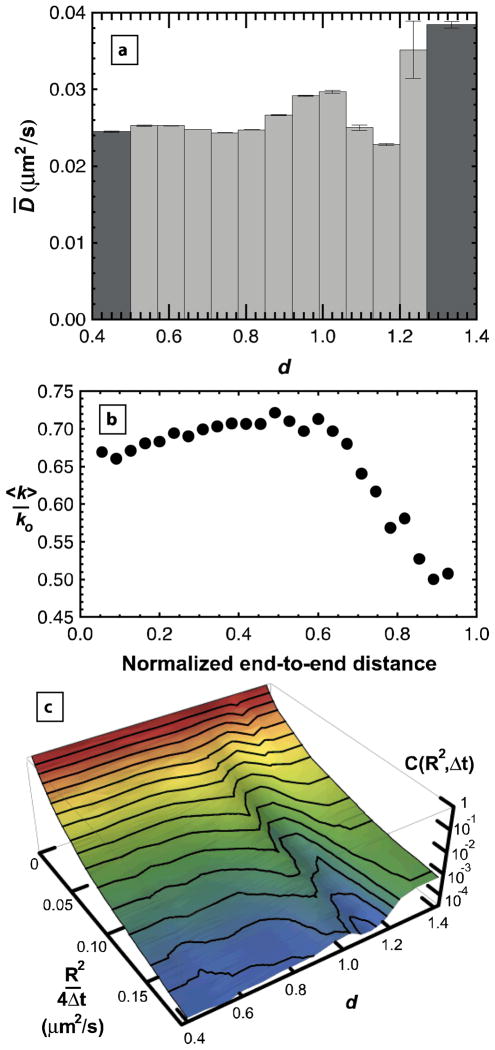
Figure 1.
Mean surface diffusion coefficient ( D̄ ) depends on relative end-to-end distance (d). (a) is elevated in the range 0.9<d<1.05 and also for 1.2≤d, indicating weaker surface interactions in this range. Bin sizes are demonstrated by the width of each bar except for the dark grey bars which also include values more extreme than the shown range for d. Error bars are calculated from the standard error determined from multimodal fits to each cumulative squared-displacement distribution. (b) Simulated average off-rate <k> is shown as a function of end-to-end distance normalized by contour length for a model adsorbed polymer with a surface interaction energy of – 0.1 kT per adsorbed monomer. An increase in <k> with increasing molecular extension is followed by a sharp drop at larger extension. This result qualitatively explains elevated D̄ for d<1.2. Off-rates are normalized by ko which is the off-rate for a polymer that doesn’t interact with the surface. (c) The cumulative squared-displacement distribution is shown as a function of d, using the d-bins shown in (a). The two ridges correspond to elevated values of D̄.

