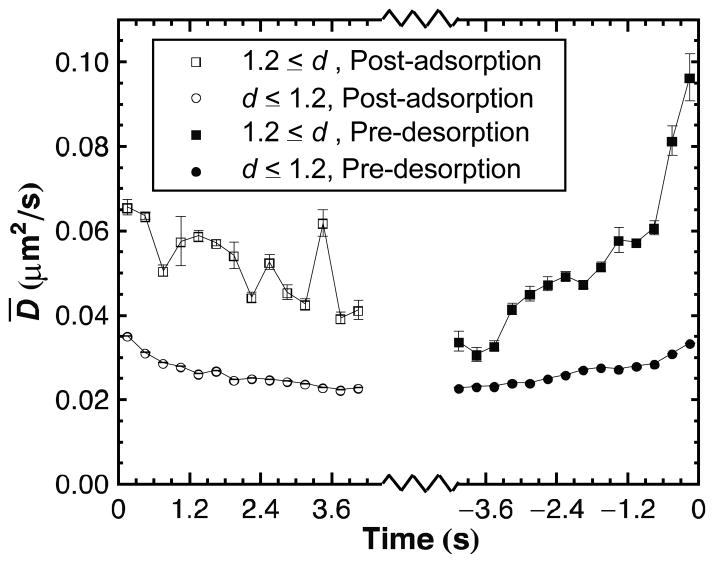
Figure 4.
Kinetics of surface attraction as determined by diffusive behavior. The mean diffusion coefficient ( D̄ ) is shown as a function of time either before desorption or after adsorption for ssDNA meeting the given criteria for d. Compact conformations (d < 1.2) show increasing D̄ prior to desorption and decreasing D̄ after adsorption. A strong trend with time, particularly before desorption, is seen for highly extended conformations (d≥1.2). Error bars are calculated in the same manner as for Figure 1.

