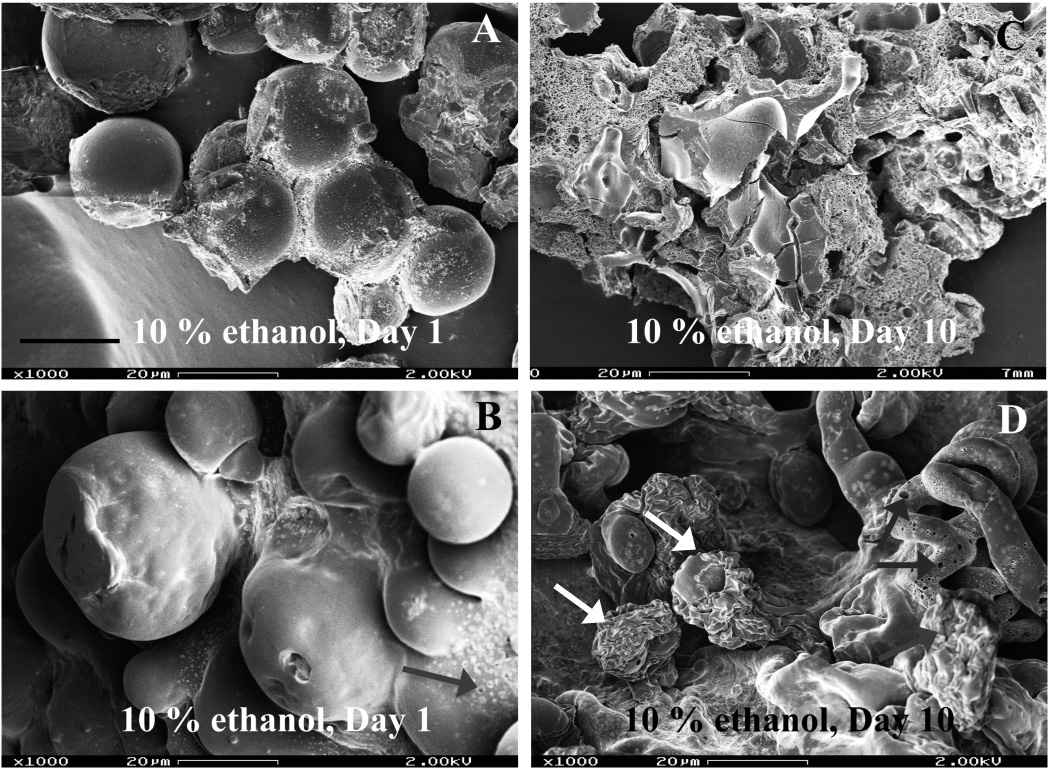
Fig. 4.
SEM micrographs of formulation 503H (PLGA microspheres and composites) after exposure to PBS (pH 7.4) containing 10 % (v/v) ethanol at 37°C over time: (A, B) day 1 and (C, D) day 10; Symbols: white arrows - “inside-out” degrading PLGA microspheres, grey arrows - porous hydrogel matrix. Top row, microspheres alone. Second row, composites. Scale bar: 20 µm.

