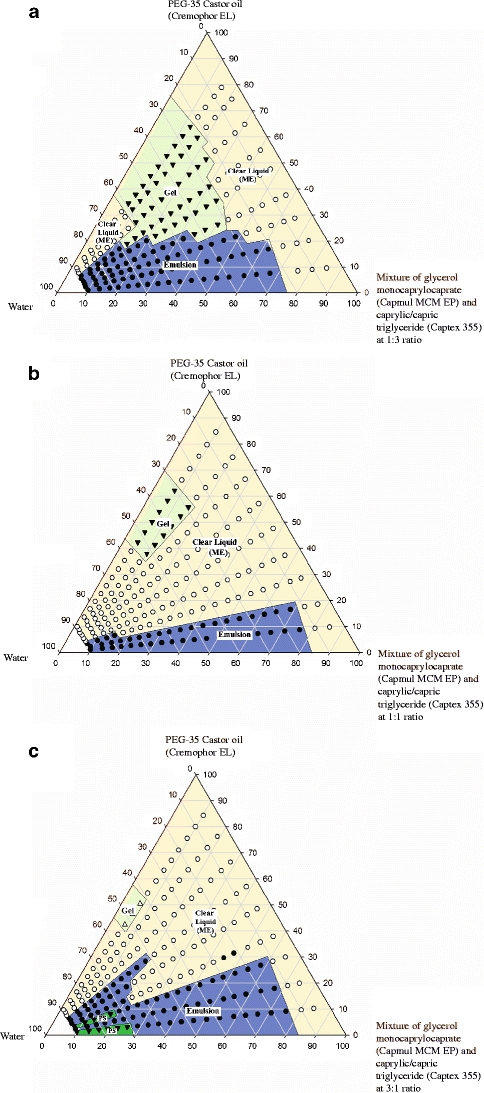
Fig. 5.

Phase diagram of mixtures of (a) glycerol monocaprylocaprate and caprylic/capric triglycerides (1:3), (b) glycerol monocaprylocaprate and caprylic/capric triglyceride (1:1), and (c) glycerol monocaprylocaprate and caprylic/capric triglycerides (3:1), in combination with water and PEG-35 castor oil. PS and ME in the figure indicate phase separation and microemulsion, respectively.
